Reaching the Dashboard
In the sidebar, open Analytics and select Dashboard, or go directly to
/dashboard. The Dashboard is also the default landing page
immediately after you sign in (see section 19.3), so in most sessions you
arrive here without navigating at all. If your previous session ended
somewhere else in the platform, sign-in may instead return you to that page.
What the Dashboard shows
The Dashboard is a grid of widgets summarizing the charging infrastructure visible at your tier — enterprise, partner, or client. An enterprise user sees tenant-wide figures; a partner or client user sees only their own hierarchy. Each visit loads current figures: KPI counts (for example, total stations, cards, and drivers), status distribution charts (stations, connectors), station analytics, and transaction activity charts.
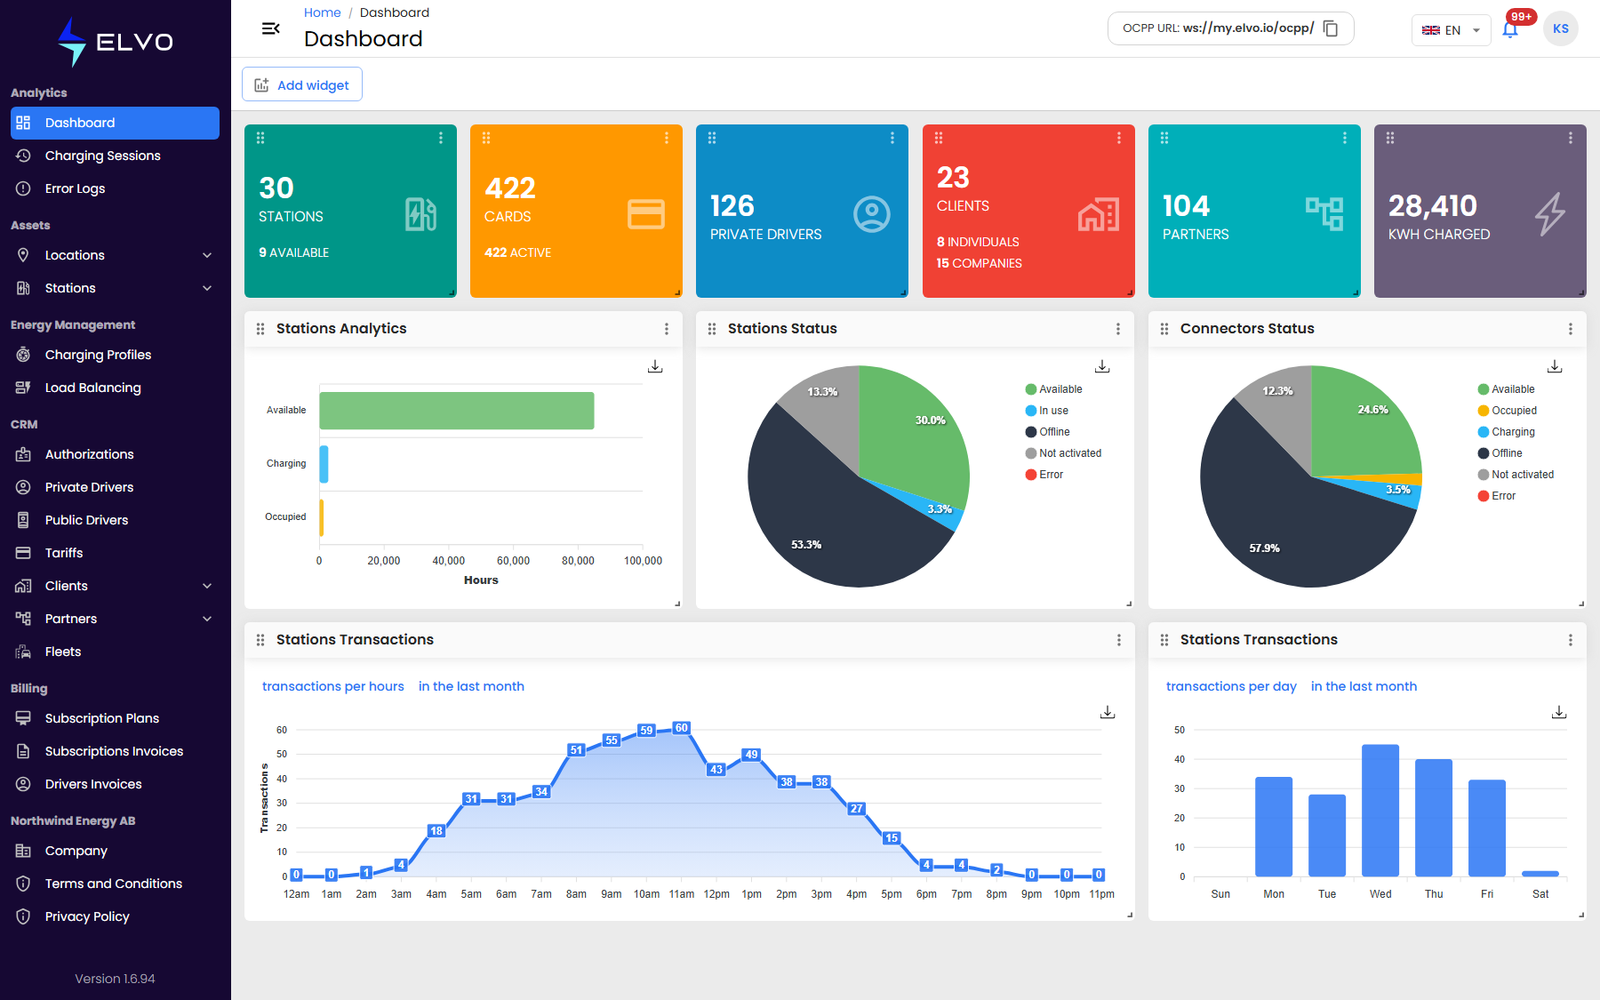
The grid is yours to rearrange: widgets can be dragged, resized, maximized, and removed (see sections 1.3 and 1.4), and you can add more from the widget catalog (see section 1.2).