One shared table component powers every list page in the platform — Charging Sessions, Error Logs, and the various asset, CRM, and billing tables among them. This section describes the behavior common to all of them; each page’s own section covers its specific columns, filters, and defaults.
Sorting
Click a column header to sort by that column: the first click sorts ascending, the second descending, and the third removes the sort. You can sort by more than one column at a time — the table applies each sort in the order you clicked the headers. Whether a table is sorted by default, and by which column, varies by page — see that table’s own section (for example section 2.3 for Charging Sessions).
Filtering
Click Filters in the table toolbar to reveal a filter row under the column headers, with one control per column. A badge on the Filters button shows how many filters are currently active, and a reset control clears them all at once.
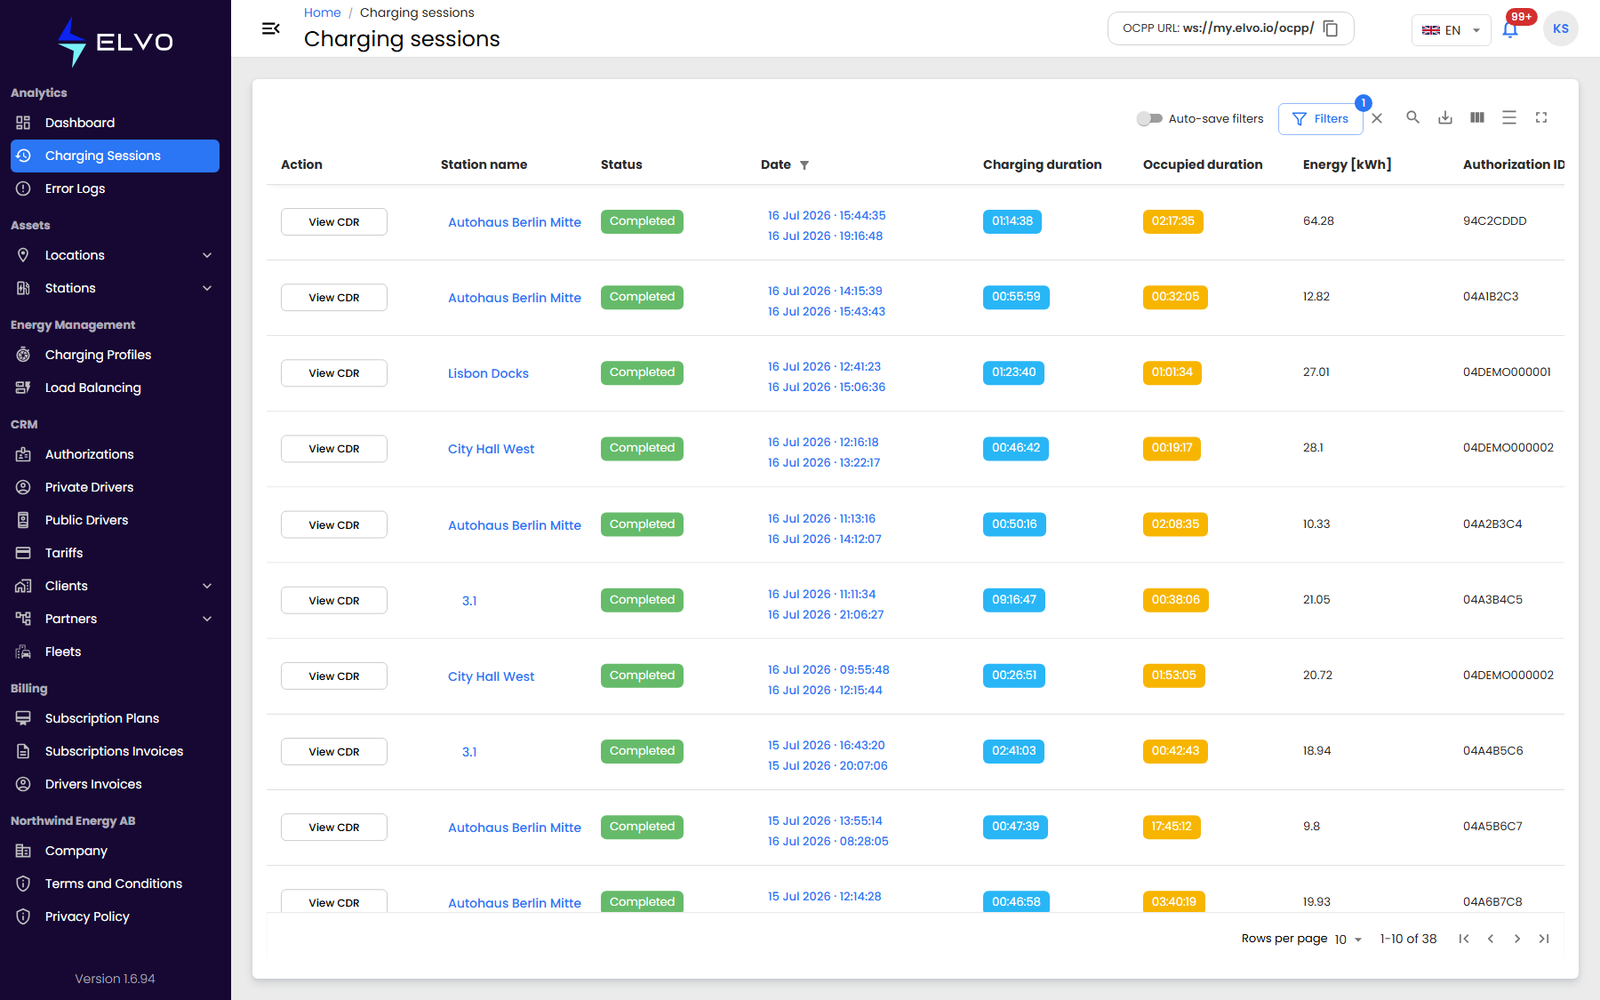
The filter control offered for a column depends on its data type:
- Text columns filter as you type, matching anywhere in the value (not case-sensitive).
- Numeric and duration columns use a range slider — set a minimum and maximum to narrow the table.
- Status-type columns open a checklist of the possible values.
- Date columns offer a start/end range plus quick-select presets (1D, 1W, 1M, 3M, 6M, 1Y).
Many tables also include a search box in the toolbar that searches across every visible column at once, for a quick lookup instead of setting individual filters (see section 2.2 for the Charging Sessions example).
A table can also open with certain filters already applied when you arrive via a link from elsewhere in the platform.
Which specific columns are filterable, and what a table shows by default, is documented per page — see for example section 2.2 (Charging Sessions) or section 3.2 (Error Logs). Whether your filter selections are remembered the next time you open a given table depends on that table’s Auto-save filters setting — see section 20.2.
Pagination
Pagination controls sit beneath the table: a Rows per page selector (10 on Charging Sessions), the current range and total (for example 1-10 of 38), and first / previous / next / last arrows. Changing the table’s settings (for example its column layout) returns you to the first page.
Display controls: density, full screen, sticky headers
Alongside filtering, sorting, and export, the table toolbar also offers a density control to switch row spacing between comfortable and compact, and a full screen control to expand the table to fill the browser window. Column headers also stay visible while you scroll down a long table.
Exporting to Excel
Every table’s toolbar includes an export icon (tooltip Export excel) that downloads the table’s current contents as a spreadsheet. The export reflects whatever is currently on screen — if filters are active, only the matching rows are included, not the entire underlying dataset. To export everything, reset the filters first, then export.
The downloaded file uses the platform’s standard export formatting: bold,
colored column headers, and dates shown as dd MMM yyyy, hh:mm AM/PM.
Column order and visibility in the file match what is currently shown on
screen. The file name includes the entity type and the export date.
The export control is disabled whenever the table has no rows to export. Very large result sets can take a few moments to generate; if the download does not start, try again.
For a concrete example, see section 2.2 (Charging Sessions) or section 3.3 (Error Logs).