Available filters
Click Filters in the table toolbar to reveal a filter row directly under the column headers — each column gets its own filter control. The ones you will use most:
- Date — the period to search within.
- Station name — narrows the list to one station.
- Connector ID — narrows the list to one connector.
- Type — narrows the list to one category of error.
A badge on the Filters button shows how many filters are currently active, and the reset control next to it clears them all and returns to the default 7-day view.
Changing a filter re-runs the search immediately. The table does not refresh on its own between changes — if you are checking for new errors, reapply a filter (or reload the page) to pull the latest data.
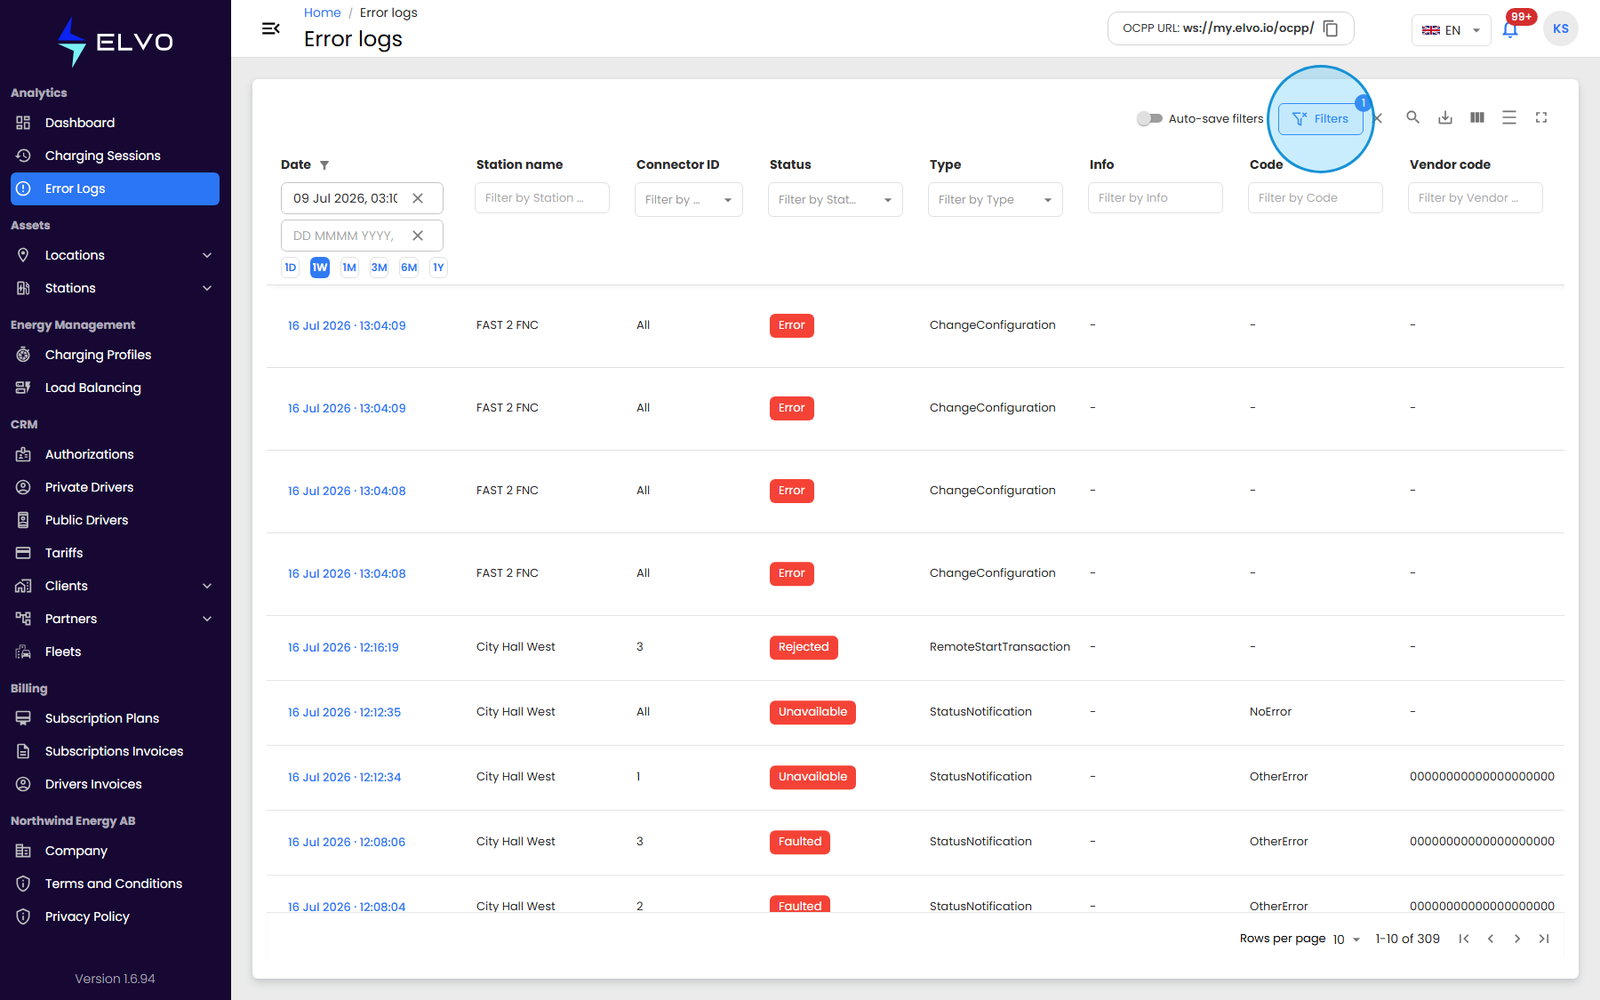
Quick period filters
Instead of setting a custom date range, use the quick period buttons — 1D, 1W, 1M, 3M, 6M, 1Y — to instantly apply a common window: one day, one week, one month, three months, six months, or one year.
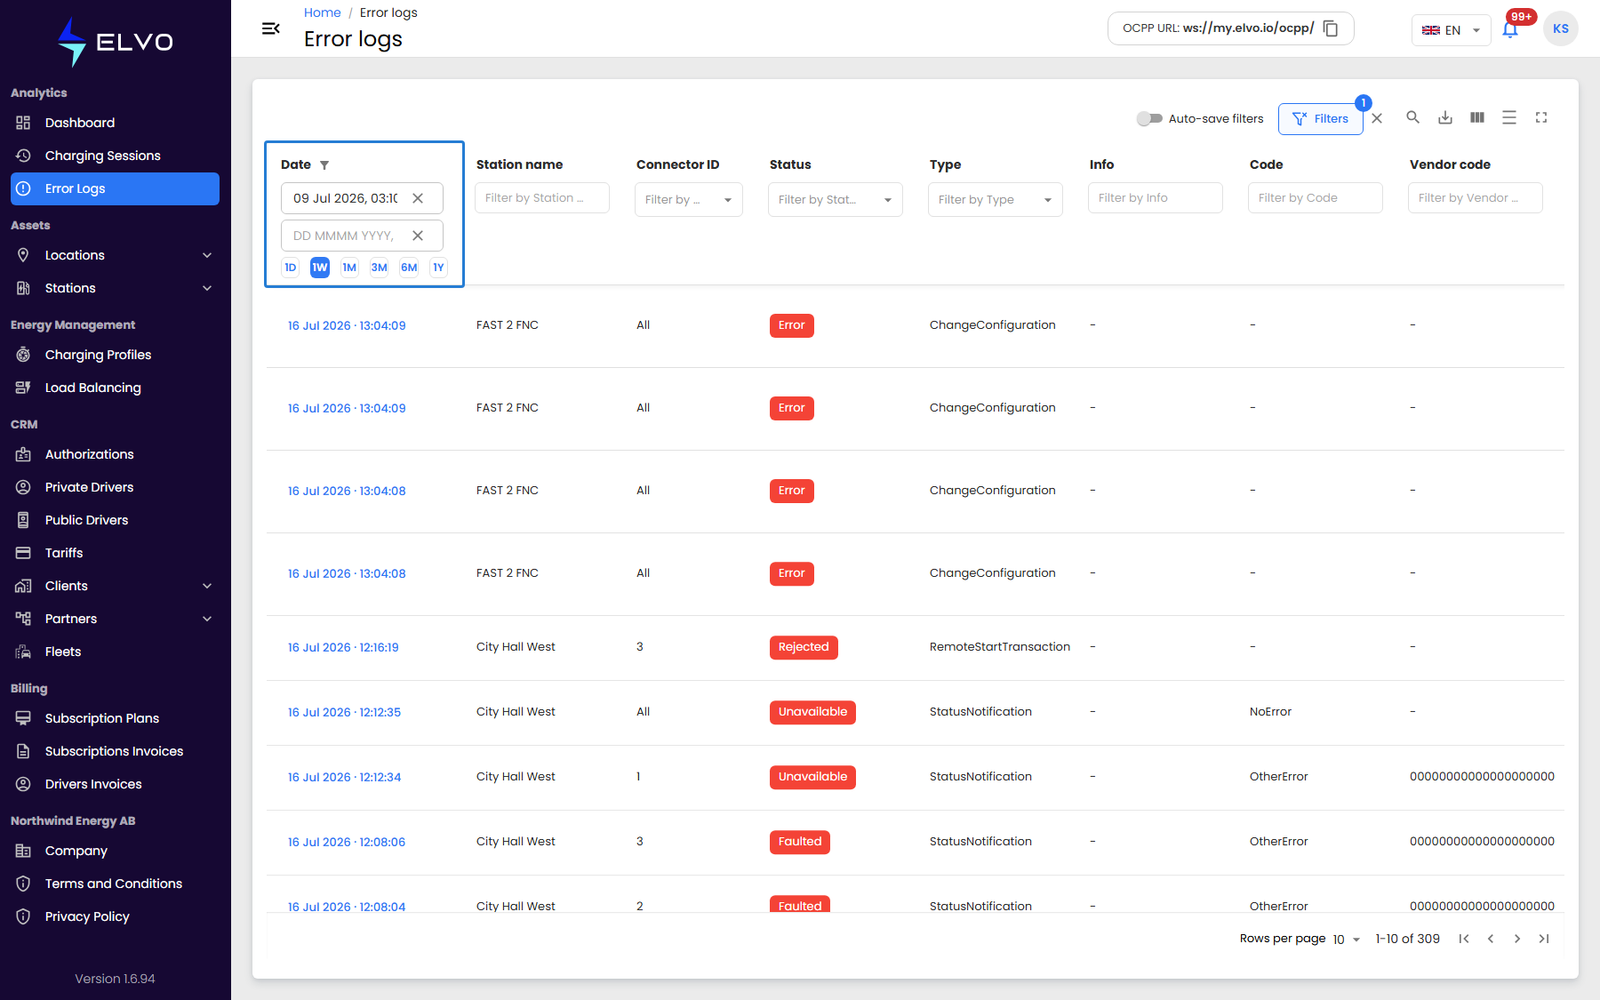
Search and saved preferences
A global search box searches across every column in the table at once, which is useful when you know part of what you are looking for but are not sure which filter it belongs to.
Turn on Auto-save filters to keep your current filter selection applied the next time you open the page. When it is off, the table returns to the default view on your next visit.
Finding recurring errors
The page does not group or count recurring errors automatically. To spot a repeated problem, combine the Station name, Connector ID, and Type filters over a wider date range — this surfaces every past occurrence of that specific issue in the table.