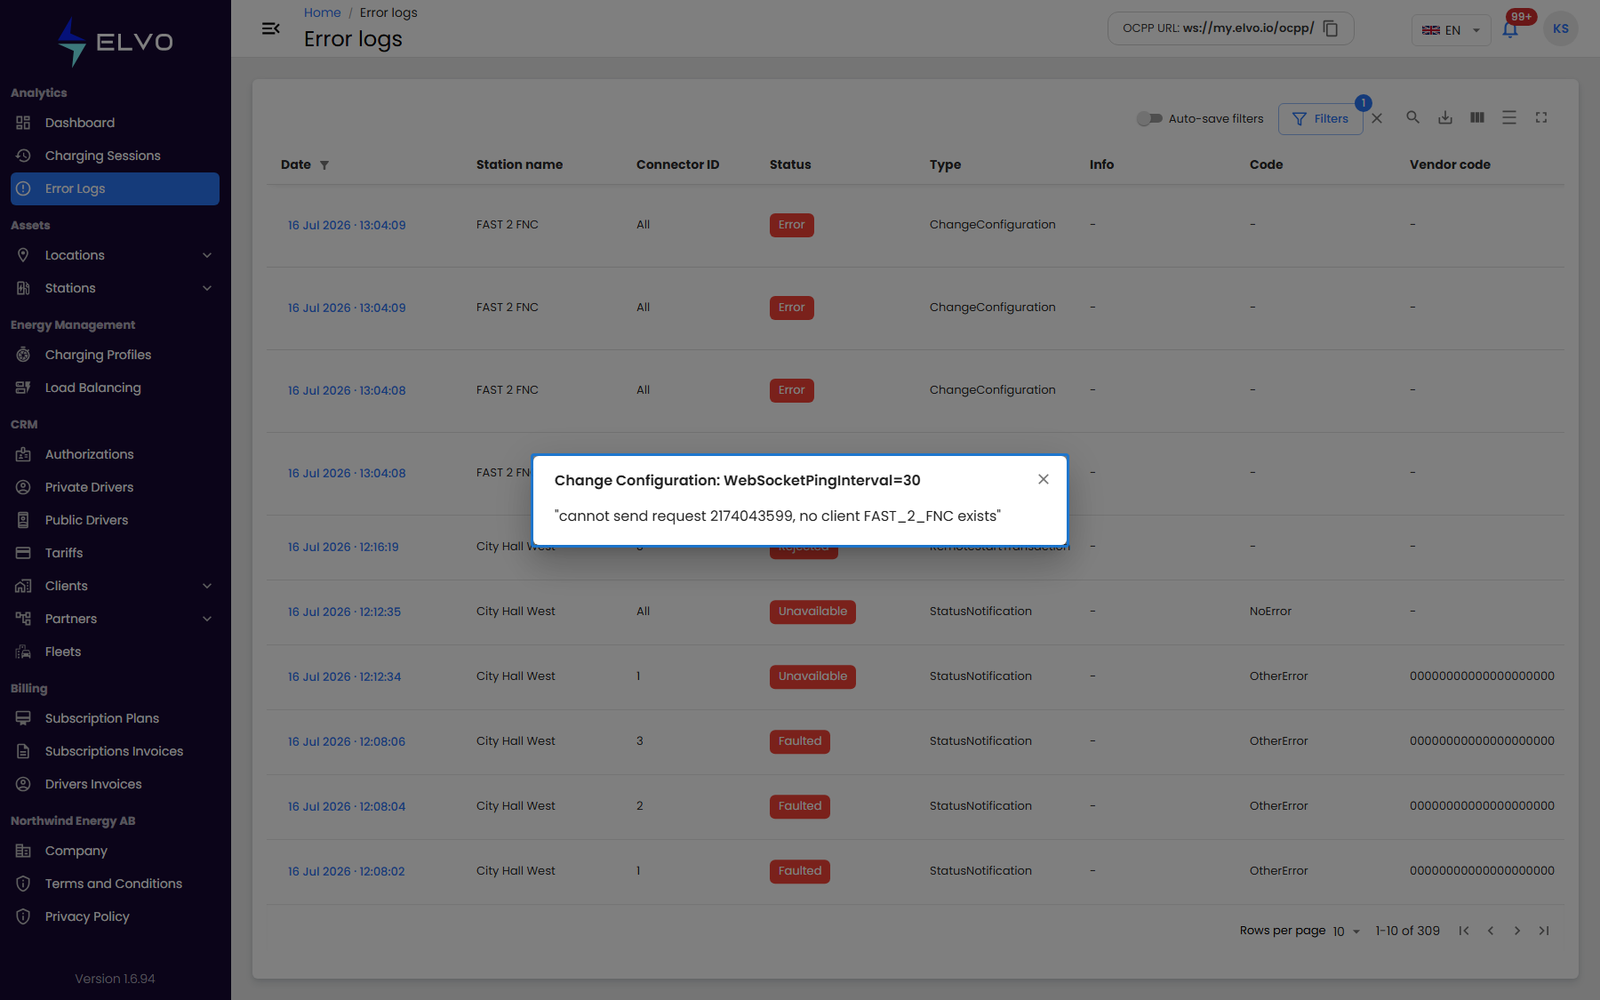
Reaching the Error Logs page
In the sidebar, open Analytics and select Error Logs. The
page opens at /error-logs, directly on the error log table — there is no
separate landing or summary view.
Error Logs is a cross-station view: it lists error entries from every station your account can see, in one table, instead of requiring you to open stations one at a time.
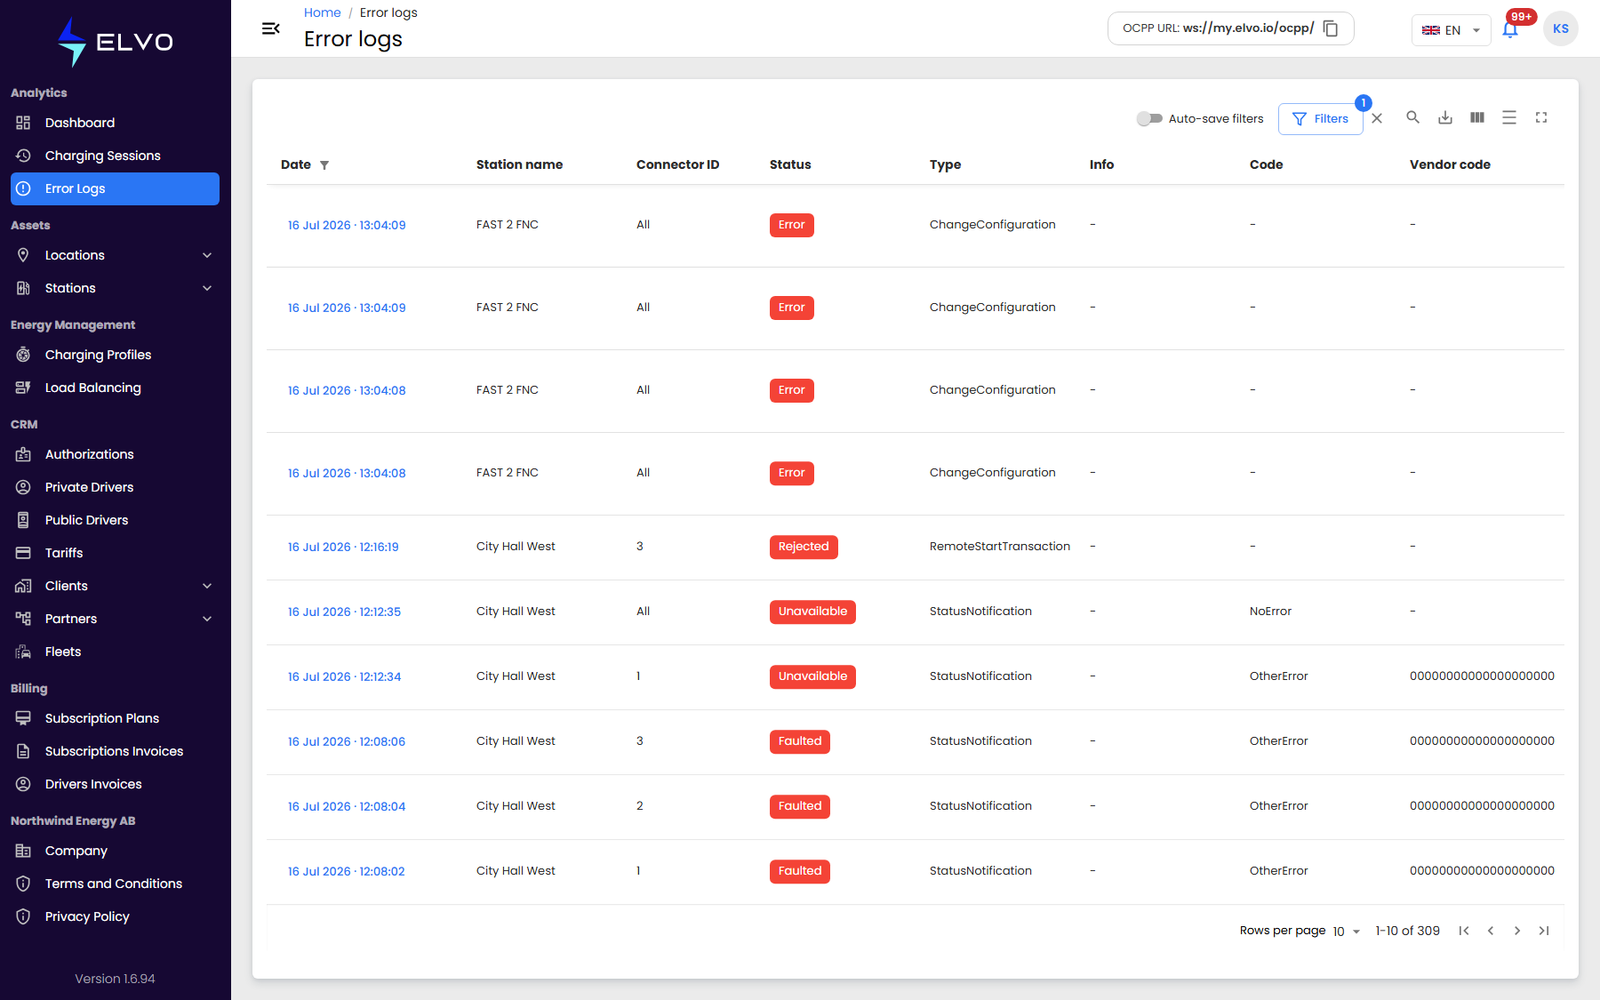
What an error log entry represents
Each row in the table is one recorded error. An entry identifies the station and connector where the error occurred, the type of error, and the date and time it was logged. By default, the table opens showing the last 7 days of activity (see section 3.2 for changing the range).
Viewing entry details
Click any row to open a modal with that entry’s full details. Use this when the row alone does not give you enough context to diagnose the problem.