Opening the widget catalog
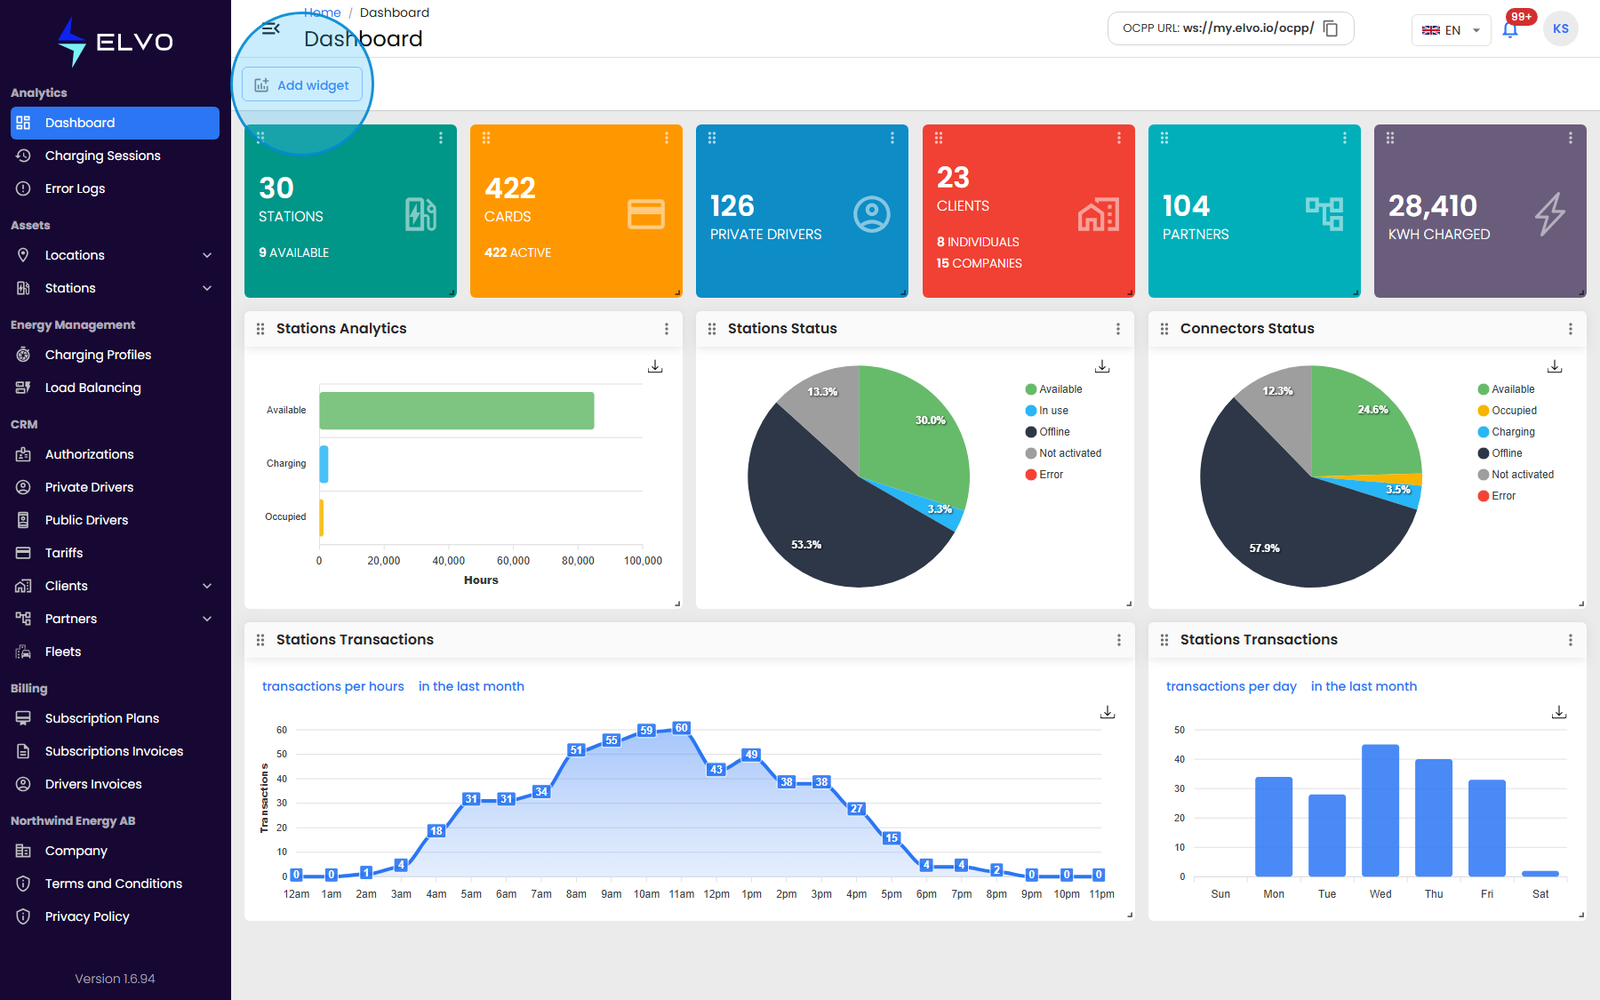
Click Add widget in the top-left of the Dashboard to open the widget catalog — a panel of widget cards that opens over the grid.
Choosing a widget type
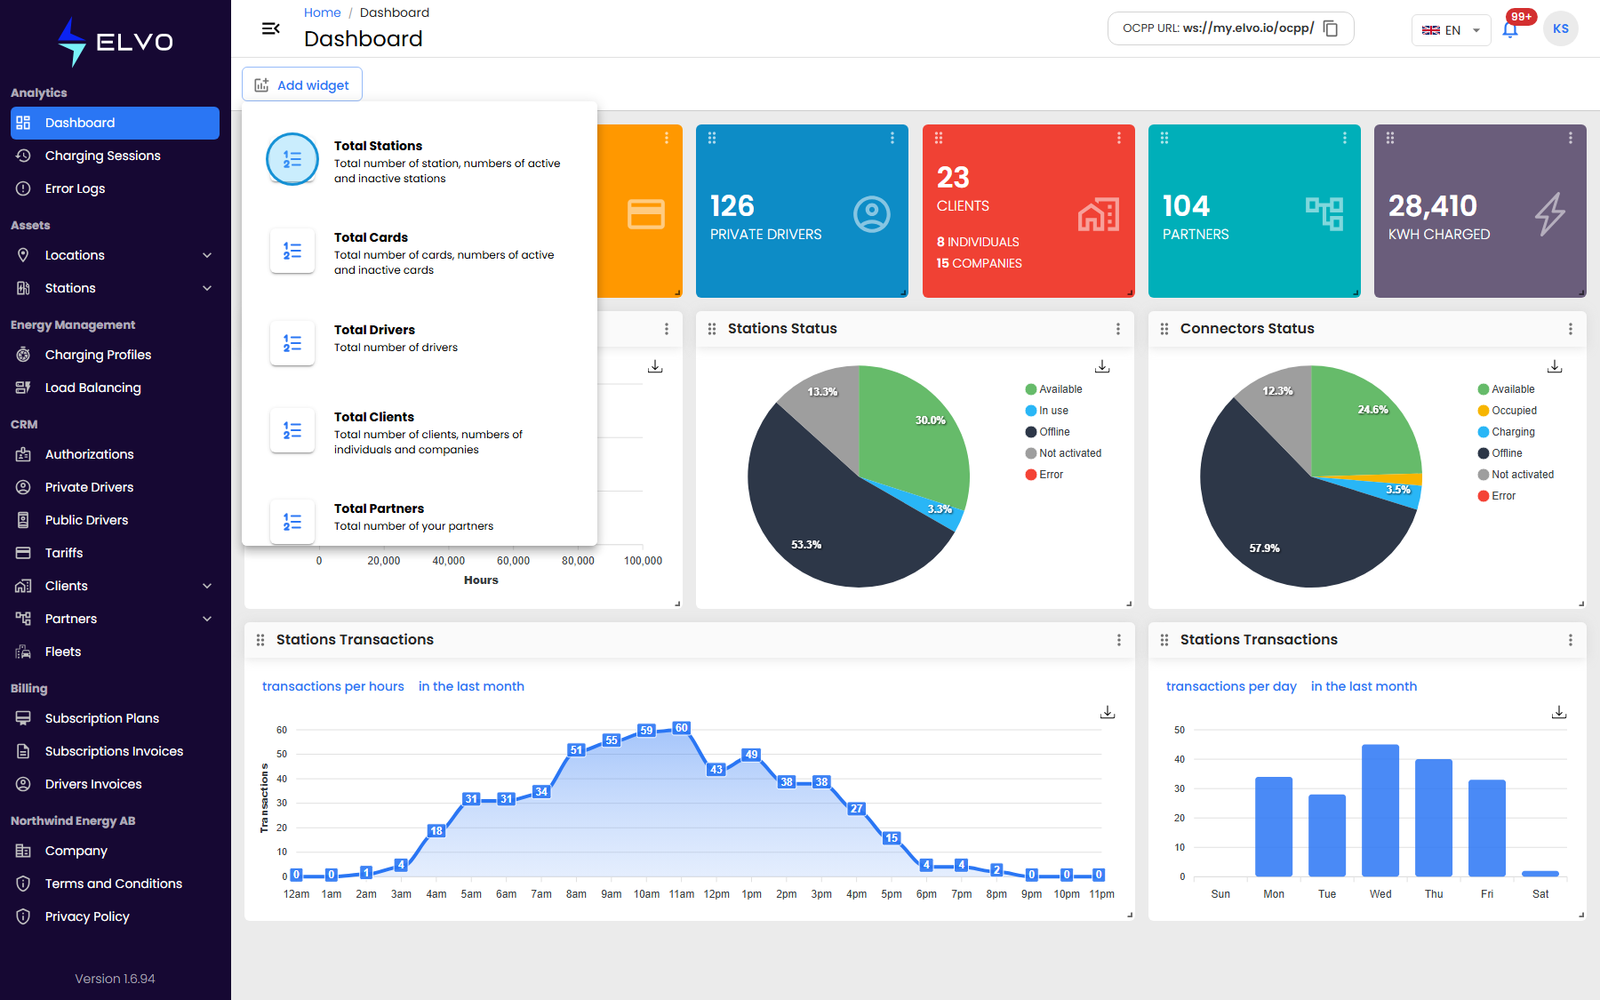
Each card shows a preview of the widget, its name, and a short description; which cards appear depends on your tier and your role’s permissions, so your catalog may look different from a colleague’s. Three tabs at the top of the panel filter the cards — All, Operations, and Analytics — and they match the two kinds of widget:
- Operations — single-figure KPI cards: Total Stations, Total Cards, Total Drivers, Total Clients, Total Partners, Total Users, Total Charging, and Total Revenue.
- Analytics — charts such as Stations Transactions (how many transactions were performed), Duration by station status, Stations Status, and Connectors Status.
Adding and configuring
Click a card to add that widget to the grid. Analytics widgets carry their display controls inside the widget itself — the Stations Transactions chart, for example, lets you switch between transactions per hour and per day, and change the period shown. Once added, the widget appears in the grid, where you can reposition, resize, or reconfigure it (see section 1.3).