What the Diagnostics tab shows
The Diagnostics tab displays the diagnostic data a station has uploaded — logs and technical data its firmware packages for troubleshooting (see section 5.1 Accessing the advanced menu for how to reach a station’s tab bar). Like Configuration and Terminal, this is a technical tool aimed at Enterprise and Partner tier users investigating a station at a low level.
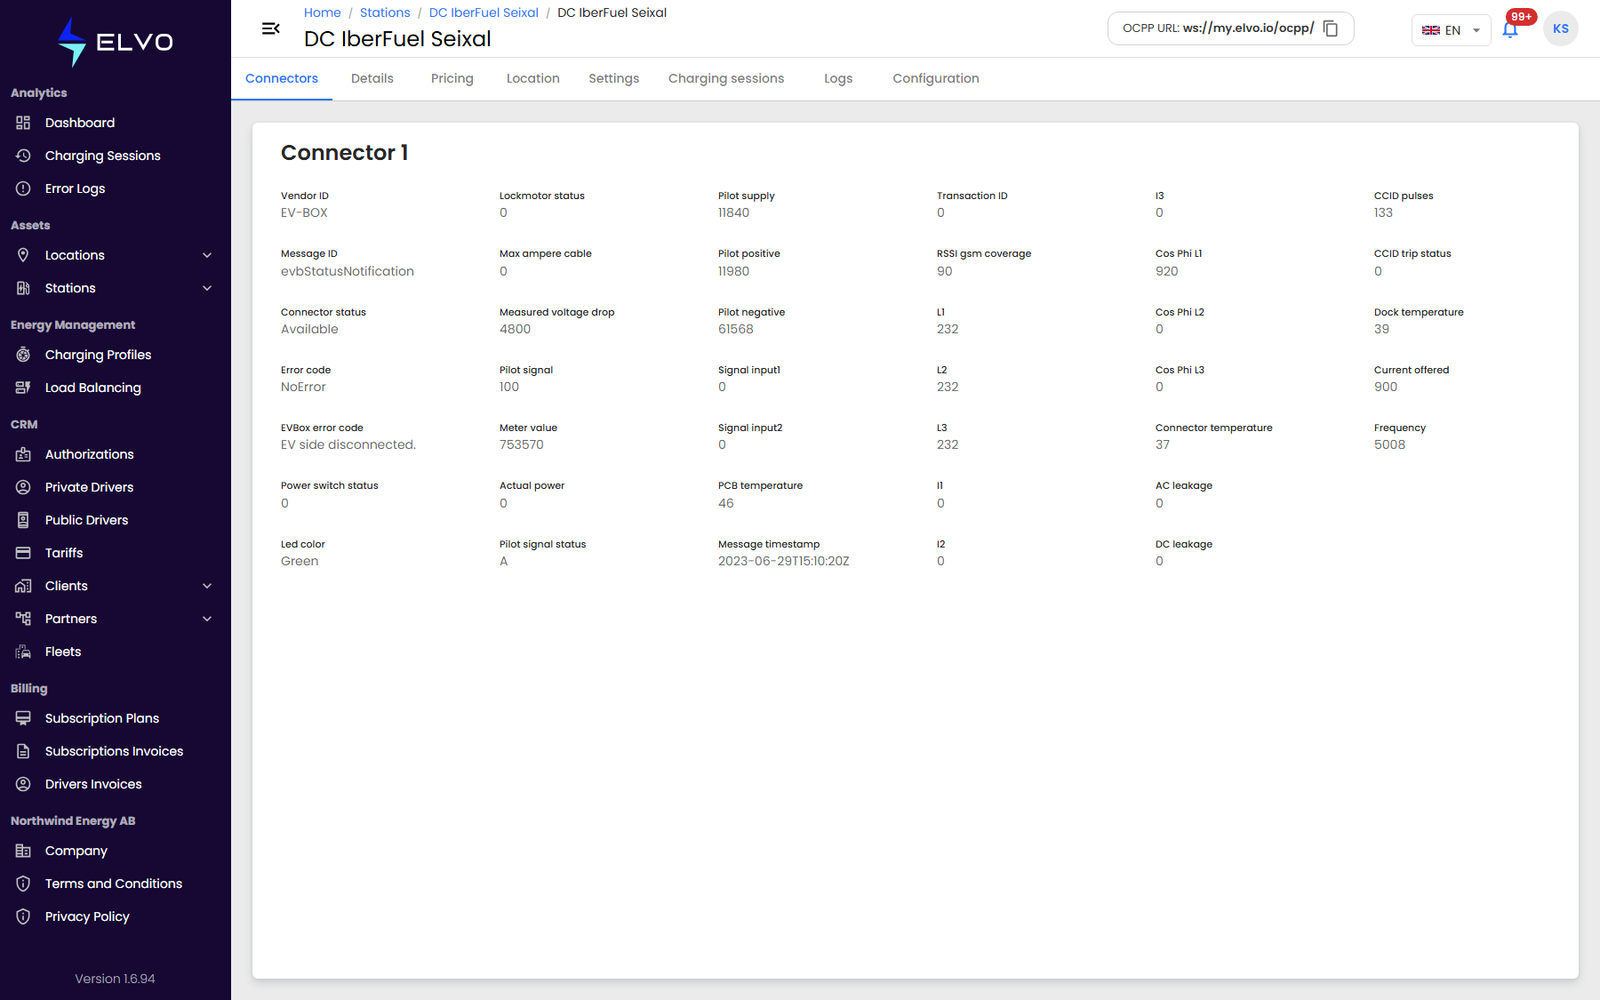
On the live platform the page (route /stations/<id>/diagnostics; the
tab may not appear in every station’s tab bar) shows a per-connector
vendor diagnostic view — for an EVBox station: connector status, error
codes, measured voltages, pilot signals, temperatures, leakage values,
and message timestamps. Where the station keeps multiple entries on
file, the page loads the diagnostic entries already recorded for
this station.
Access
Unlike most station tabs, access to Diagnostics is not currently restricted by your assigned role. Anyone who can open this station’s detail view can open this tab and see its contents, regardless of their permissions elsewhere in the platform.
If there is nothing to show
If the station has no diagnostic entries on file, the table is empty. If the request to load the table fails, an error message explains why. If this tab includes a control to request a new diagnostics upload, the chatbot must treat it the same as any other OCPP power-user action in this part: present it explicitly and get confirmation before triggering it, never firing it from inference alone.